


Why Mondays Might Be Your Healthiest Day: What 1,000+ Sleepers Taught Us About Recovery
There’s something strange that happens on Mondays. If you are anything like me, you probably don’t hate them but they are definitely not your most loved day of the week. But biologically? The data tells a different story.
At Terra, we recently ran an analysis on wearable data from over a thousand (Oura) users, focusing on two key metrics: sleep duration and heart rate variability (HRV). We sought to gain insight into trends in recovery, stress, and overall well‑being. What we found surprised us.
How We Sleep and Recover
Across the entire dataset, the average sleep duration was 7.06 hours, with a standard deviation of 1.19 hours. The mean overnight HRV was 44.19 milliseconds, with a large standard deviation of 26.81 ms.
That spread tells us something important: people vary wildly, both in how long they sleep and how their autonomic nervous system behaves. We must note that this data is based on a 28-day sample of over 1,000 users, which provides insights into a population of wearable users rather than individuals.
Weekly Rhythms: The Hidden Patterns of Recovery
I was interested to see how the population trends would present when we looked at the data by day of the week. We include HRV delta here to demonstrate the change in the state of the nervous system between today and yesterday. More on this later, but if the world were simple; a good nights sleep would be accompanied by an improvement in HRV from yesterday.
| Day | Avg Sleep (h) | Avg HRV (ms) | Avg HRV Δ (ms) |
|---|---|---|---|
| Monday | 7.08 | 45.55 | 3.18 |
| Tuesday | 6.99 | 46.14 | 0.59 |
| Wednesday | 6.96 | 44.86 | -1.28 |
| Thursday | 6.97 | 44.11 | -0.75 |
| Friday | 6.94 | 43.67 | -0.44 |
| Saturday | 7.18 | 42.48 | -1.19 |
| Sunday | 7.28 | 42.37 | -0.11 |
The pattern here is fascinating: on average that population sleep the most on Saturdays and Sundays (Friday and Saturday nights), but HRV peaks on Mondays and Tuesdays.
Why? Likely because HRV isn’t just about sleep. It is multifactorial (more on this later!) and reflects cumulative strain. If we’re running a sleep deficit all week, a Saturday lie‑in doesn’t fully restore the baseline. The data suggests that the benefits of the weekends rest kicks in a day or two later — explaining why HRV is highest on Monday or Tuesday.
It’s also worth noting that HRV drops as the week wore on, hitting its lowest values by the weekend. That implies we’re not just tired before the weekend; we’re likely bringing a full week of accumulated load into it. This is nicely visualised in the graph below where we have distinguished between a positive and negative HRV delta.
You can see from Figure 1 that the mean HRV delta trends diverged over the weekend, both the mean of the positive and negative deltas increased, most probably demonstrating an increase in the variability of our weekend activities!

How Common Are Highs and Lows?
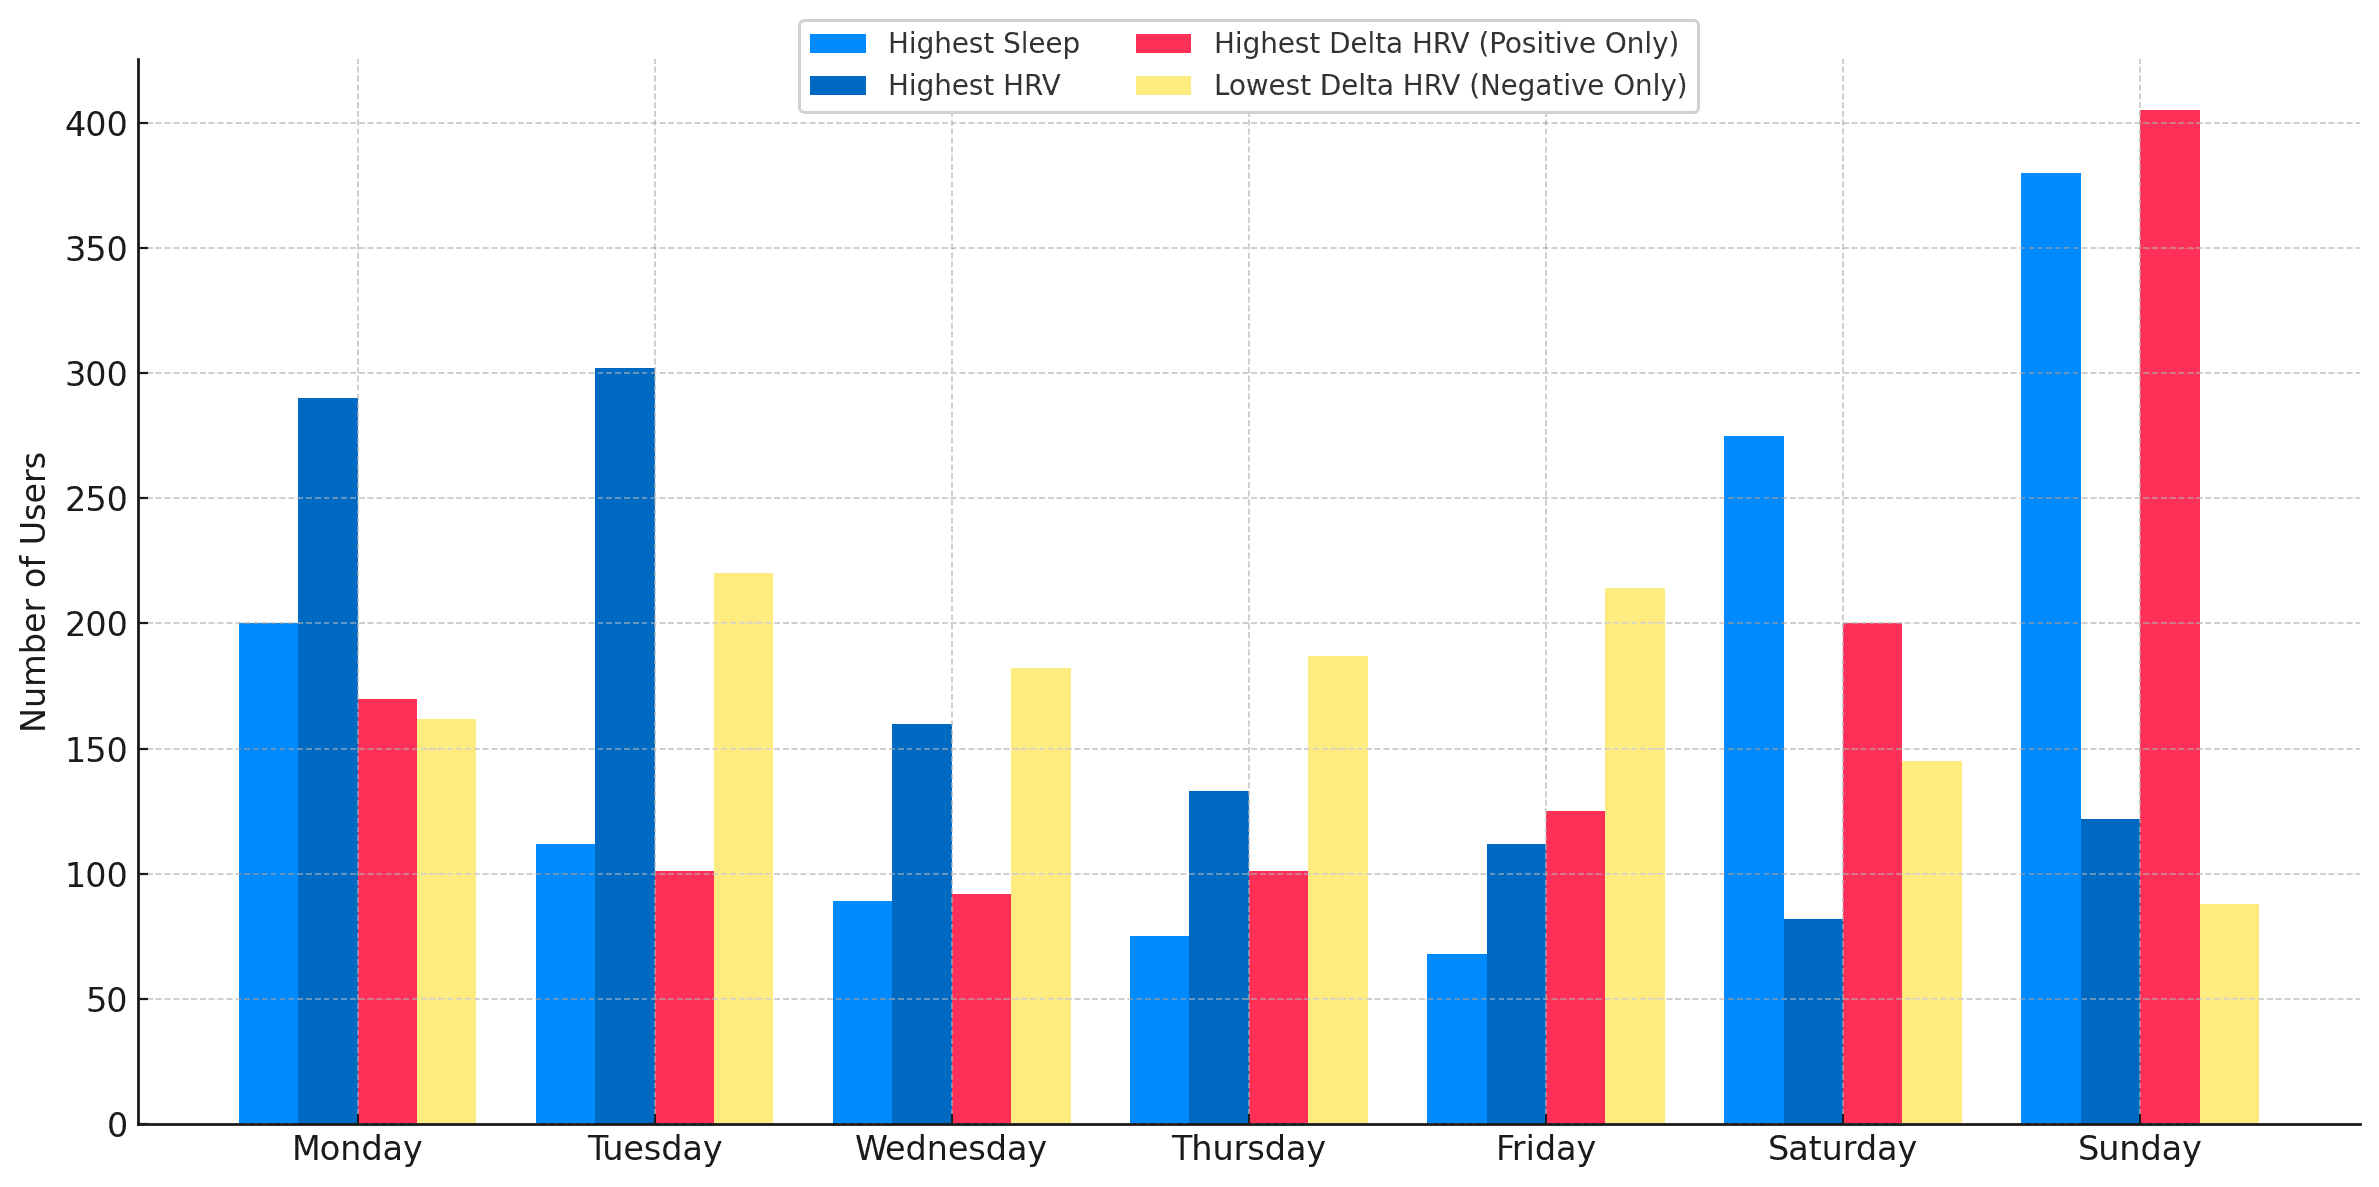
We also looked at how often people hit their personal highest or lowest HRV and sleep values on each day of the week.
Highest HRV by Day: Most common on Monday (295 users) and Tuesday (213)
Lowest HRV by Day: Most common on Sunday (293 users) and Saturday (253)
Highest Sleep by Day: Most common on Sunday (354 users) and Saturday (291)
Lowest Sleep by Day: Slightly more spread out, but Saturday (209) and Friday (196) lead
This confirms a simple but powerful (and some may say, obvious) insight: the weekend is when people try to recover, and early week is when their systems reflect this. But the weekend is when there is the most variability. We know this already, as it is when people have the most flexibility to choose how they sleep. We can chose to sleep and recover or enjoy ourselves on an evening!
Sleep Archetypes: Three Types of Sleepers
Next we clustered users into three groups based on their average sleep and how variable it was. This is both interesting and a way to start to model data by learning about types of user.
| Cluster | Description | Avg Sleep (h) | Std Dev (h) |
|---|---|---|---|
| 1 | Longer, more consistent | 7.74 | 0.96 |
| 0 | Average sleepers | 7.01 | 1.01 |
| 2 | Shorter, more variable | 6.23 | 1.07 |
Not surprisingly, these groups showed differences in HRV:
| Cluster | Mean HRV (ms) | Std HRV (ms) |
|---|---|---|
| 1 | 45.01 | 11.01 |
| 0 | 44.12 | 10.12 |
| 2 | 42.03 | 9.03 |
Zooming Out: A 28-Day Trend
We also looked at 28 days of rolling trends, from April 19 to May 16, 2025, to see how these metrics evolved over time. Check out figure 3 to see how these patterns play out over a four week cycle. From a trend perspective over the 28 days:
- Sleep duration showed a very slight decrease: -0.0061 hours/day
- HRV showed a slight increase: +0.0248 ms/day
- Positive delta HRV declined: -0.0130 ms/day
- Negative delta HRV declined: -0.0125 ms/day
This suggests people may have been sleeping slightly less but experiencing slightly more stable recovery. We don’t know the location of the users, but its a good bet that most of them are in the northern hemisphere, and sleep less as the days get longer. We also see an increase in mean HRV with decreased deltas in both directions (variability). This could also be a seasonal effect.

So What Do We Take From This
Firstly, on average HRV rebounds early in the week. Don’t write off Mondays. They might be the most biologically resilient day we have! Secondly, sleep habits matter and it’s not just how much we sleep, but how consistently. Thirdly, the weekend is for recovery, but that recovery may not show up immediately. We can learn a lot from our patterns, not just our averages. Look at trends, not just snapshots. If your HRV is tanking on Sunday, it might be time to think about taking it a bit easier over the weekend (whatever that means for you!)
Over the next few weeks we will be analysing all the data we can find and publishing all of the insights. Is there anything you’d like to see?


